About
This Shiny app accompanies the manuscript titled 'Transformation of summary statistics from linear mixed model association on all-or-none traits to odds ratio'. This application is designed to map regression coefficients from a linear (mixed) model (LMM) to the odds ratio from genome-wide association studies (GWAS) on disease traits. It has been shown to be effective at mapping effects generated from a linear mixed model GWAS to the odds ratio. This allows for a comparison between effects generated from logistic regression from other GWAS studies.
Reference allele frequencies can be used if the user's summary statistics do not have sample allele frequencies. If this is the case then please add a column named 'FREQ' with the reference allele frequency for the effect allele.
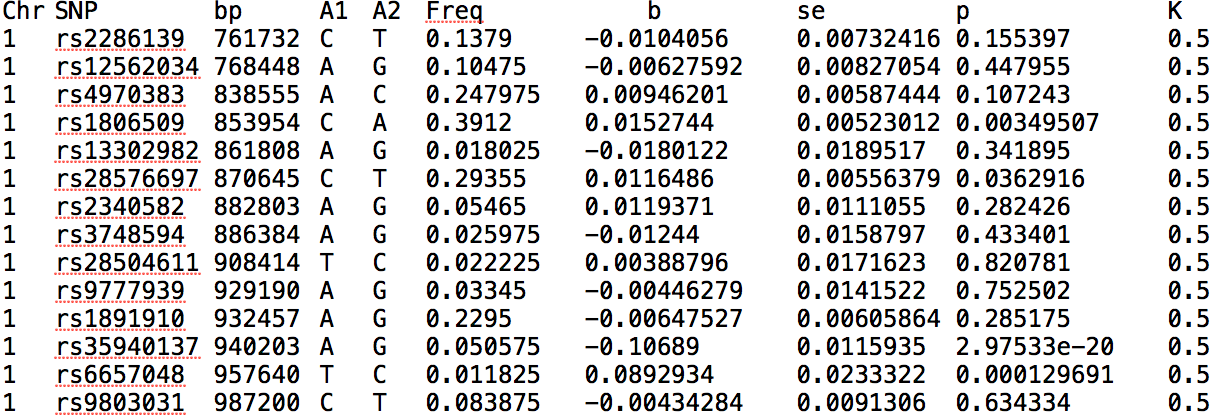
Data formatsThe application supports most summary statistics formats from LMM GWAS and requires at least the allele frequency for each SNP, the prevalence in the sample k (written as K in the header of the file), and the estimated effect. The below snapshot shows an example format from GCTA. Note that not all columns are required. PLEASE LIMIT WHOLE FILE TRANSFORMATIONS TO 1M VARIANTS.
If transformations for more than 1M variants are required please download the R function below, which can be used as a standalone function within R.
lmor_func.R
Please download some test data to investigate the workflow of this app, which is tab delimited.
test_data_lmm.txtThe application workflow is as follows:
i) the user loads a set of summary statistics results generated from a linear mixed model GWAS analysis using Browse button under the 'Choose file' heading. A HEADER FOR THE FILE IS ASSUMED. Different delimeters can be chosen. A sample prevalence value must be stipulated before loading. If each variant or a set of variants has a different sample prevalence then this can be supplied as a new column of the to be loaded summary statistics set. This column must be named 'K'.
ii) the user then inspects the loaded summary statistics results generated and the mapped OR in the 'Load and inspect' tab.
iii) the user can then download the results from the 'Download' tab.
The 'Individual locus test' tab can be used to map individual effects or check results from a larger set.
For further questions, please contact l.lloydjones@uq.edu.au. This app was developed by Luke Lloyd-Jones.
Browse for file to load data
Download
Transformed odds ratio
Adjust the inputs on the left to investigate a single variant transformation.